Crypto Charts for Beginners: How to read Cryptocurrency Charts
The global economy is a lucrative sector to make money. However, many people do not understand how the global financial markets trend. Everything works in a pattern, and without a platform to help the day-to-day trader analyze the markets, the trader will incur hefty losses from a wrong interpretation of the market strengths.
This is why crypto charts are important in the life of every trader. In this article, we shall delve deeper into how to read crypto charts and how they can be useful to a crypto trader.
What Are Crypto Charts?
A crypto chart is a graphical representation of the price movements of a given crypto asset. It is a sequence of prices that is drawn over a certain time on the chart. Traders can determine the direction of the trend and be able to make successful predictions.
Every trading chart has a vertical axis and a horizontal x-axis. The vertical y-axis signifies or shows the price of the asset that is being traded, while the horizontal x-axis shows the timescale. Prices are charted from left to right across the horizontal axis.

The most recent price movement will appear on the farthest right. The time frame for plotting crypto charts will depend on how much data we visualize. Longer timeframes have much more compressed data.
The timeframes on a crypto chart differ from ticks to one minute to five minutes to 10 minutes, and to daily, weekly, monthly, and even annually. The lesser details you want to be displayed on the chart, the lesser the compressed data you will need.
Types of Charts
There are several different types of crypto charts that traders can use to understand and interpret the crypto market. These crypto charts can be used to visualize the price movement of different financial instruments and provide an accurate prediction of an emerging trend.
These crypto charts include line, bar, candlestick, and Heiken. Ashi. Each of these crypto charts has its advantages and limitations. Here is a small discussion about how each of them works.
The Line Chart
This one includes one piece of trading information, which is the last price that is traded during the time frame usually known as ‘close.’ Market traders who trade daily consider the closing price to be more important than the opening price.
This is because intraday swings can be insignificant if one takes into account only the closing price. A line chart there uses the closing price of the crypto asset as the most important data point. It allows the trader to have a clearer picture of the daily price trend of a given asset.
The Bar Chart
The bar chart is one of the most popular trading charts for day traders. The chart is designed to give traders a clear view of the highs and lows of an asset at any given time. For each period of the price action to be plotted, high, low, and close prices are needed.
The open price is not compulsory. However, it is used if it is available. But most bar charts do not include the open price, meaning that the chart is dominated only by the close price and of course the highs and the lows that day.
Bar charts are more advantageous when displaying large amounts of data compared to other charts like candlesticks. The individual bars in the chart are relatively thin and enable users to fit more data in the chart before it gets cluttered. This makes bar charts a bit better than line charts. While line charts show less clutter, they offer less detail.
The Candlesticks Chart
This one originated from Japan and has become very popular in the recent past. The candlestick needs open, close, high, and low prices to form. A weekly candlestick is based on price opening on Monday, the intra-week high and low range, and the price closing on Friday.
Every candle on a daily chart represents one day. The majority of investors use the candlestick charts since they ease in the relationship between open and close. Candlestick charts can also be able to predict a bull or bearish run for a crypto asset.
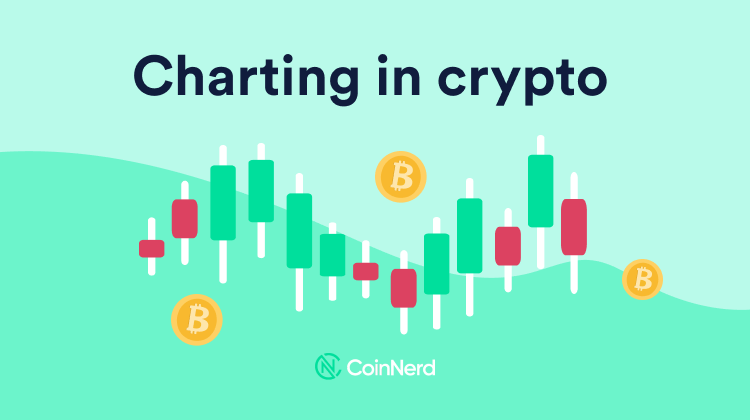
If the candlestick is green, it indicates bullish price movement while the red candlesticks signify a bearish trend. The body of the candle is the distance between the close and the open, while the shadows are the lines that reach above or below the body and represent the high and low for the respective period in the crypto chart.
Although candlestick charts can be hard to read and interpret for a beginner, they offer highly conclusive market data. A lot of day traders will use a candlestick chart to predict the general short-term trendline of individual crypto assets.
In essence, while you cannot precisely say where the price will close or open, you can predict with a higher degree of confidence whether it will go up or down by simply looking at the candlestick chart.
Heiken Ashi Chart
The Heiken Ashi is somehow similar to the candlestick chart and was also created by Japanese traders. The Heiken Ashi chart came much after the candlestick chart and is one of several tools designed to give you a comprehensive view of the market.
It is also faster and easier to read and understand than candlestick charts. Hence, the Ashi charts are more suitable for people who are new to trading. The method used to calculate and plot the candles on the Heiken Ashi chart differs a lot from the candlestick chart. In candlestick charts, the candle shows four different prices: the open, the close, the high, and the low price of that timeframe.
Every kind of tick in the chart is also different and independent from the previous candlesticks and has no relation with the previous or the subsequent candlestick. On the contrary, Heiken Ashi candles are calculated and plotted using some information derived from the previous candle.
The open price, the close price, the high price, and the low price are all required to calculate and plot the Heiken Ashi candle. But there will be more interrelated data as well. A Heiken Ashi chart also moves slower than a candlestick chart. Therefore, signals given by a Heiken Ashi chart are delayed.
However, this delay makes the Heiken Ashi candle a good indicator for volatile trading assets. It reduces the chances of rushing in and making mistakes and also helps you to avoid trading against the market.
Additionally, the delay in the Heiken Ashi chart provides a smaller number of false signals. Hence traders who use these charts make fewer false moves or make fewer mistakes during the trading session.
Heiken Ashi candles are easier to read because they do not have too many distinct patterns. Heiken Ashi charts help traders to follow the trend. They will allow you to enter a position when you are at the beginning of a strong uptrend but this may take time. Therefore, these charts are good for traders who are patient or disciplined enough to wait for good entries.
Where to Find Charts
Charts are important for making the correct decisions in trading, and therefore, it is important to know where to find charts. The good news is that there are several services these days that are fully dedicated to the provision of these charts.
For example, charts can be found on a platform called Crypto Charts, which is a type of software used to serve crypto asset traders with trading analysis and trade execution tools. Crypto Charts provide charts coupled with order-taking methods and help the traders automate trading and analysis.

It is also important to note that most charts differ greatly and vary depending on the broker. There are many different crypto charts in the marketplace so be sure to check out other chart providers as well for the best picture.
Some of the things traders can consider before choosing a specific crypto chart include responsiveness, quality, and reliability. Additionally, traders can check whether the broker is providing analyzing tools. Most crypto charts can also be accessed through a demo account so you don’t need to fund or open a live trading account to analyze the market.
Qualities of a Good Crypto Chart
As noted above, trading charts are not the same and will vary a lot from broker to broker. While many chart providers do the best they can to deliver accurate and reliable charts, this is not always going to happen. But certain general attributes will define a high-quality chart in the first place. Here are some of them:
Responsive
This is the ability of a crypto chart to close or open trades in the shortest possible time. Crypto charts on platforms with a large slippage may cause problems for the trader during times of high-impact news or high market volatility.
As a trader, you want to choose crypto charts with high responsiveness since they are often up to date with the most recent price action. This will allow you to have more control over the opening and closing of positions.
Reliable
Depending on the type of software and hardware the trader has, they should choose the best crypto chart for the equipment. A reliable crypto chart is always working. If there is any scheduled maintenance of the service or platform, the platform administration will communicate in advance to allow traders to prepare adequately for the event.
Crypto charts that crash or often freeze during times of high-impact news are not reliable. They can result in massive losses for traders who are caught unawares. Aggressive traders will always benefit from choosing crypto charts that have a high level of adaptability as well.
This means that they rarely crash even when used on mobile devices as well. Such charts can be trusted to continue offering reliable price quotes even during times of high market volatility.
User friendly
When choosing a crypto chart, it is important to choose platforms with a user-friendly interface. This will help the trader to understand the layout of the platform so as not to make mistakes while trading.
Trader orientation is important and helps in reducing the number of mistakes a trader will make because of the lack of enough orientation of the platform.

As a rule, you may want to use the demo account or trial option for these charting software solutions first. That way, you will have a feel of the platform, the user interface, and how everything works.
By the time you are getting into the real market, you will have known where every tool is and how to quickly analyze your charts.
Good Crypto Charts Also Provide Analysis Tools
Many analysis tools may help a trader to chart and make correct predictions. Tools such as plotting software and chart indicators will help traders in identifying patterns on the chart.
Indicators on the other hand will help in clearing out extra noise from the chart to show where the market is trending. This will help traders avoid trading against the market, something that can pose a huge risk to capital.
Good Crypto Charts Offer the Security of Data
This simply means that traders should not feel worried when giving out their data to a crypto charting platform. If you feel that the crypto charting platform is not secure enough to keep your personal information private, then it is important to move on and find a platform that is capable of upholding the security and the confidentiality of the customers.
Exposing the personalities of customers can present a very real problem of stolen funds. Besides, sometimes you may need specific financial information including credit card details to access certain charting solutions. The last thing you need is for this important info to fall in the wrong hands.
Technical vs. Fundamental Analysis
When looking at trading charts in crypto, there are two broad forms of analysis you can do. They include technical analysis and fundamental analysis.
Now, there could be various additional analysis methods under each of these two broad options. But in general, they are all fundamentally different in interpretation and execution. Here is a simple explanation of both these analysis options:
Technical Analysis
Technical analysis is a method of evaluating crypto assets by looking at the statistics that have been generated by the market activity over a given time frame. These statistics include past prices and the volume of the assets exchanged.
Technical analysis allows the trader to use the chart and the tools provided to identify patterns that can predict future trends of the underlying asset. The trend is the trader’s best friend, especially in highly volatile markets like crypto.
In technical analysis, traders always assume three things. The market discounts everything, the price moves in a trend, and history tends to repeat itself. In technical analysis, price movements are believed to follow a general trend, which means that after a trend has been established, in the future, the price movement is more likely to move in the same direction regardless of volatility.
Also, the idea that history tends to repeat itself in terms of price movement has been proven time and time again not just in crypto but in many other assets. The repetitive nature of price movement has been attributed to market psychology.
Hence, traders can predict the direction in which price will move by studying the history of the price action in the past. This is based on the belief that based on trading psychology, traders will often react the same way when certain market conditions are manifested.
How Is Technical Analysis Done?
Technical analysis relies upon the help of a range of statistical tools to help strengthen the trader’s decision. Some of these tools include pivot points, channel, moving averages, exponential moving averages, Doji Candlesticks, standard deviation indicator, Bollinger band, Commodity Channel Index, relative strength index, and the stochastic oscillator.
These are just a few of the numerous statistical tools that have been developed to help traders make the correct decisions while trading. Technical analysis, while presenting numerous advantages for the trader, has some limitations. Traders should be very careful when entirely basing their strategy on certain types of indicators.
This is because these indicators express information that has happened in the past and try to infer conclusions on what is happening in the present. They are not reliable for predicting the future. Hence traders have to be careful when attempting to use such types of indicators to predict the future of the market.
The great news is that these days technical analysis tools are available for everyone, meaning that the level of competition between beginner traders and expert traders is high since both of these parties are using the same tools to try and corner the market. Since the majority of the traders are using the same strategies based on the same tools, many will make the same end decision.
This leads to predictable behavior such as placing predictable support and resistance zones. In the crypto trading landscape, uniqueness is important. Hence unique traders are the ones that make the most profits.
For instance, when everyone is selling, a unique trader should be buying, and when everyone is buying, a unique trader should be selling. But again, all trades must be supported by reliable underlying data and research.
Fundamental Analysis
The other type of analysis is the fundamental analysis which stands for the entire study of the underlying forces that impact a given asset.
The fundamental analysis represents economic indicators, such as government and central bank policies, civil affairs, war, natural disasters, and other calamities that may affect the global economy.
In the world of financial markets, there are habits. Traders can be classified into either fundamentalists or technicians, and as a trader, it is important to identify which group you fall in. Fundamental analysis is an effective method that can be used to project the overall economic state of the world and preempt systemic risk in the market.
While fundamental analysis cannot predict the actual market prices, it can predict the direction in which the overall market is likely to move in based on prevailing geopolitical, monetary, and economic factors.
The trader who closely looks at the market conditions using fundamental analysis will most of the time establish a model on which they can base the trading strategy. A model for predicting future events could be a huge asset in executing trades.
Limitations Of Fundamental Analysis
Different people would interpret the same set of data in very different ways, hence, drawing different conclusions about the impact an event or new set of data would have on the market. While using fundamental analysis, it is important to understand the expectations of the general market.
This is because trading against the market will surely destroy and blow your account. If the market is likely to react in a bullish way to the news, it is advisable to trade in the direction of the market’s expectations. If the market is giving a bearish sentiment on the oncoming news, then it is possible to be bearish and trade with the market’s direction.
Sadly, sometimes markets will not react to news as expected by fundamentalists. This leads to the saying among traders that indeed the market has a “head of its own”. What you may consider high impact news may pass off so fast without any big changes in the price action.
Conclusion
Understanding the markets is a necessity for every trader. To understand how the markets are moving, it is important to understand the trading charts, especially for very volatile cryptocurrencies.
Traders also have to understand the events that move the market. As mentioned above, you have to understand your trading strategies and decide where they fall (fundamental or technical). In the same way, it is good, or traders must be both fundamental and technical in their analysis of the market to ensure that they get the maximum positive outcome from the market trends.
* We hope this information will help you in your investment process, but this is not investment advice. Every investment carries risk, especially in this industry, so DYOR before making a decision.


