
Picture the cryptocurrency market as a bustling metropolis, where towering skyscrapers represent established coins like Bitcoin and smaller buildings symbolize altcoins. BTC Dominance (BTC.D) acts like a helicopter hovering above, revealing the percentage of the skyline occupied by Bitcoin compared to the rest.
What Is BTC Dominance?
Imagine the cryptocurrency market as a bustling bazaar, with each stall representing a different coin and its value reflected in the size and splendor of its tent. BTC Dominance (BTC.D) acts like a magnifying glass, focusing on one particular tent – Bitcoin’s. It shows you, as a percentage, how much real estate Bitcoin occupies compared to the rest of the bazaar.
For example: If you were blindfolded and spun around in the crypto market, there’s a 60% chance you’d bump into Bitcoin first, with altcoins making up the rest of the landscape (based on current BTC Dominance).
Picture the early days of cryptocurrency, a wild west frontier where Bitcoin reigned supreme. It was the “Lone Star Coin,” occupying 100% of the market, its BTC Dominance (BTC.D) the undisputed sovereign of the realm.But history, like the crypto market, is fickle. As new tokens burst onto the scene, the landscape transformed. Altcoins, once mere prospectors, started chipping away at Bitcoin’s monopoly. Its once-impenetrable BTC.D gradually eroded, until it reached a historical low of 35.41% in 2017. Bitcoin, the king, dethroned, was now forced to share the throne.
That’s where BTC Dominance (BTC.D) comes in, acting as a lighthouse on TradingView, helping you navigate the market’s shifting currents.BTC.D is a simple yet powerful metric, expressed as a percentage, that tells you how much of the total cryptocurrency market cap belongs to Bitcoin. Think of it as a gauge of Bitcoin’s influence and strength compared to all other coins combined.
Why Is Bitcoin Dominance Important?
Imagine the crypto market as a dynamic dance floor, with coins and tokens swirling under the spotlight. Bitcoin, the seasoned dancer, once dominated the floor, occupying the center stage. But as the music changes and new players emerge, its position shifts. Here’s where BTC Dominance (BTC.D) takes on a crucial role for investors, acting as a flashlight that reveals the underlying rhythm of the market.
- Bull market: During the early phase of a bull market, investors often discover newer altcoins, leading to a drop in BTC.D as their market share rises. The total market capitalization still increases, but Bitcoin’s relative dominance temporarily declines. Later on, as market euphoria escalates, investors often flock back to Bitcoin as a safer haven and store of value, causing BTC.D to climb again.
- Bear market: In a bear market’s icy grip, investors prioritize risk aversion. They flock to Bitcoin as a perceived safe haven, driving up BTC.D while the total market cap plummets.
During market recovery, investors often prioritize established assets like Bitcoin, leading to a rise in BTC.D. While Bitcoin prices climb confidently, altcoin prices generally experience slower or smaller gains, reflecting their higher risk profile.
So In A Micro Perspective, How Is BTC.D Used?
While Bitcoin reigns supreme in size, its crown isn’t always tightly fastened. Changes in BTC.D, the king’s market share, directly impact the fortunes of altcoins, sending their prices soaring or plummeting like courtiers vying for favor. For investors, BTC.D becomes a crystal ball, revealing whether to place their bets on the established monarch or the rising stars among the altcoin ranks.
For example, a two-pronged catalyst, according to some investors, could unlock an ‘altcoin season’ for the cryptocurrency market.
- Bitcoin Dominance shows signs of decreasing.
- Market capitalization increased.
BTC Calculation Formula & Tracking Tool.D
Formula To Calculate BTC Dominance
Cracking the BTC.D code is easy. Divide Bitcoin’s market cap by the total market cap, then multiply by 100%. This simple formula unlocks a powerful tool for analyzing Bitcoin’s influence and potential investment opportunities in the wider market.
No more spreadsheets! Powerful tools monitor BTC.D fluctuations with laser precision, empowering investors to make informed decisions and capitalize on market movements instantly.
BTC Tracker.D
Beyond real-time BTC.D tracking, these tools go the extra mile, offering data-driven analysis to help you stay ahead of the curve and capitalize on emerging market trends.
- TradingView: Unlock the secrets of BTC.D with TradingView’s advanced tools. Beyond just tracking, their platform offers comprehensive analysis of Bitcoin Dominance, along with real-time data for all major indexes and built-in tools for sophisticated price analysis.
- CoinGecko, CoinMarketCap: Need a reliable BTC.D pulse check? Look no further than Coingecko and CoinMarketCap. These platforms continuously update both Bitcoin’s cap and total market cap, instantly calculating the index, while TradingView steps up with additional tools for those who want to analyze BTC.D trends and make informed decisions.
The toolbelt doesn’t stop there! Powerhouses like Glassnode and Messari join the ranks, offering even deeper dives into BTC.D and other market metrics.
On-ramp Operations Via Stablecoins
Smart crypto newbies know: start with stablecoins. Platforms like Binance and Coinbase cater to this by offering easy purchases of USDT, USDC, and other stablecoins. This lets users navigate the market with familiar, stable values before exploring riskier assets like Bitcoin. As a result, much of the fresh money entering crypto flows through stablecoins initially, creating a buffer between newcomer cash and Bitcoin’s price fluctuations.
More crypto options, less Bitcoin reliance? Stablecoins make it happen! With hundreds of tokens readily available to trade with USDT and USDC on platforms like Binance, users have plenty of choices beyond Bitcoin. This wider access to alternative investments can potentially impact Bitcoin’s dominance in the market, as reflected in the BTC.D index.
In addition, many investors believe that holding stablecoins is still the optimal strategy to mitigate volatility and preserve assets during a downtrend.
Narrative/Trend
Narrative is a term that refers to a trend that is of interest to the community and is discussed on many platforms. For example, in 2017, many investors poured money into ICO projects, leading to a boom in these projects. Therefore, it can be said that ICO was a narrative in 2017.
In the early stages of the cryptocurrency market, Bitcoin’s market capitalization once accounted for 90% of the total market capitalization. However, as the market matures, Bitcoin is increasingly being seen as a “stable” asset as it does not offer high enough returns to investors. As a result, altcoins are receiving more attention from investors as they have high volatility, allowing investors to achieve their desired returns, despite the fact that altcoins can lead to greater losses than Bitcoin.
Unlike Bitcoin, altcoins are created with a variety of different purposes, from gaming, art, to financial services such as lending/borrowing. Therefore, depending on the overall trend of the market, the attention and capital of investors will pour into a certain area (narrative).
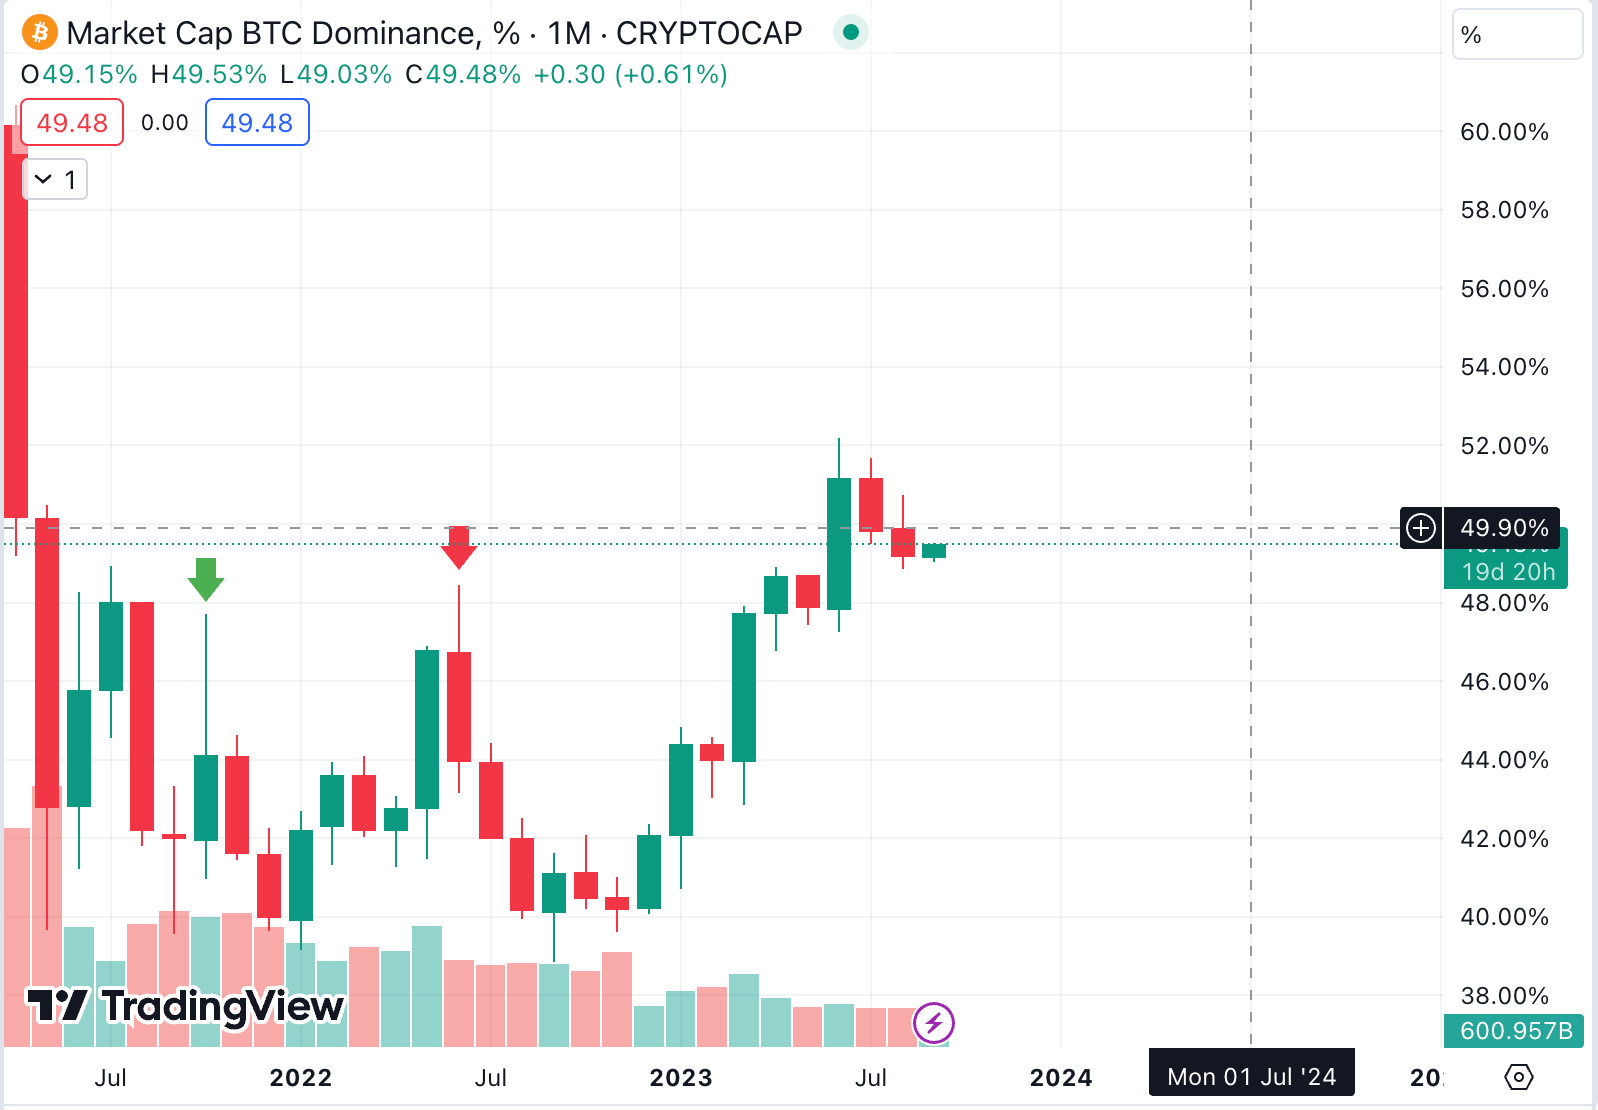
For example, in 2021, the narrative surrounding NFTs received a lot of attention from the community, causing the prices of NFT projects to suddenly skyrocket. At the same time, Bitcoin Dominance fell from 70% to around 50%.
Bitcoin Price Volatility
Bitcoin is a coin with a fixed supply of 21 million, so the only thing that can directly affect the BTC.D capitalization index is the value of each BTC.
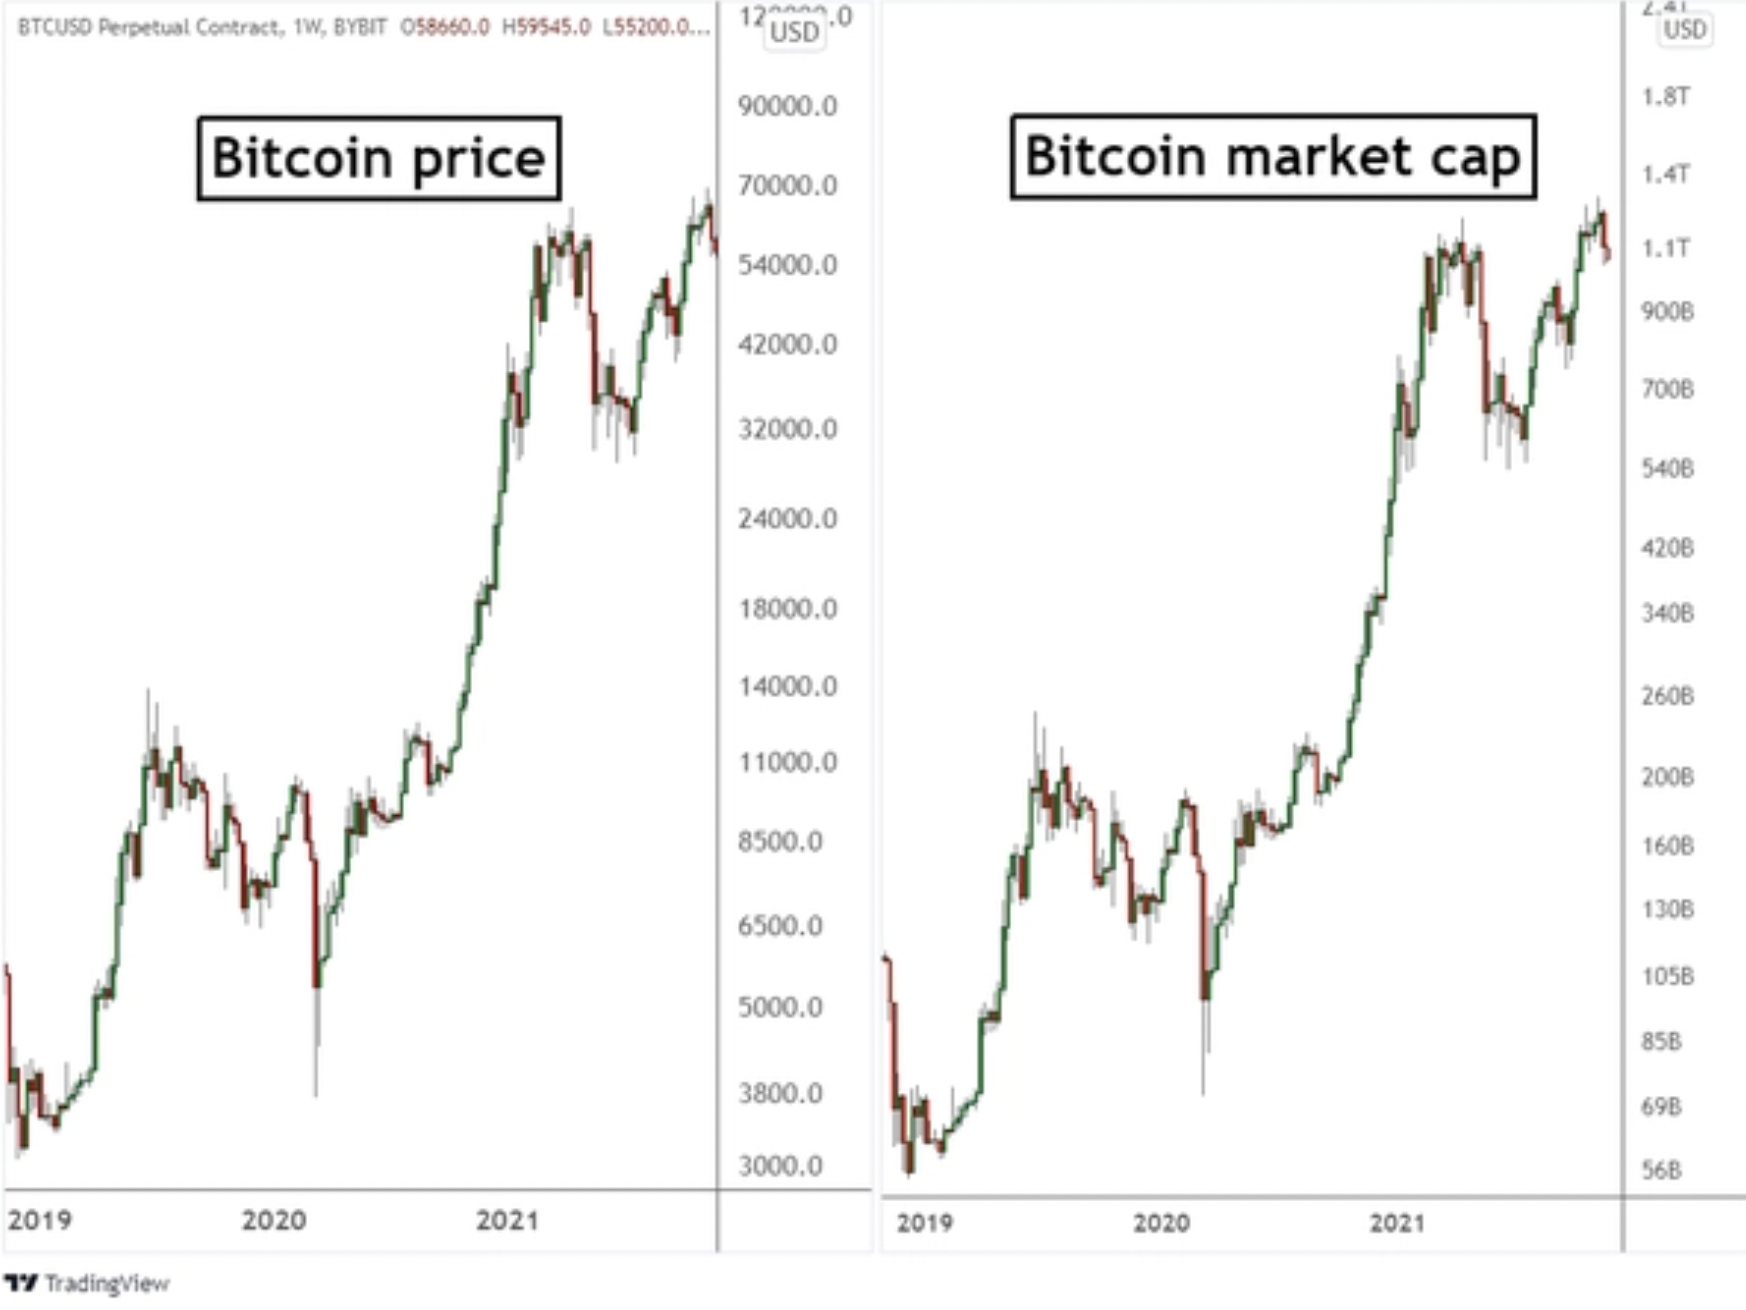
As can be seen, when the price of Bitcoin goes up, the market capitalization of Bitcoin also increases gradually, thereby causing the BTC.D index to increase. However, users should note that when the market capitalization of Bitcoin or the BTC.D ratio goes up, it does not mean that the price of Bitcoin will follow suit.
Advantages & Disadvantages Of BTC.D In Trading
Similar to other technical analysis methods, using BTC Dom in trading still has advantages and disadvantages. Here are some of the advantages and disadvantages of applying BTC.D:
Advantages
Here are some of the advantages of using BTC.D in trading:
- Ability to predict market volatility: BTC.D helps users predict changes in the cryptocurrency market. When BTC.D suddenly increases, this could indicate the determination of investors in Bitcoin, and lead to a bull run for the crypto market.
- Market analysis: BTC.D helps investors track market trends by measuring the market share of Bitcoin against the total value of the cryptocurrency market. When BTC.D increases, this could indicate that Bitcoin is showing strength against other cryptocurrencies. Conversely, when BTC.D decreases, it could mark the rise of altcoins.
- Use in technical analysis: BTC.D is often used in technical analysis to predict fluctuations in the cryptocurrency market. Traders and market analysts often use it to identify entry or exit points
Disadvantages
In fact, the approach to Bitcoin Dominance often has a bias towards technical analysis, therefore, the process of determining BTC.D will also have limitations similar to technical analysis:
- Analysis may have errors: The main feature of technical analysis is to use historical data to predict the future, so errors are inevitable.
- Relative: At the same time, with the same chart, with the same indicators, but two analysts can make two opposite conclusions. Therefore, BTC.D is also only relative, not entirely accurate.
Due to the above limitations, when using BTC.D to analyze the market, investors should not rely solely on it but need to have a reasonable capital allocation plan. In addition, investors can also combine with fundamental analysis and technical analysis to choose the optimal entry point.
The Correlation Of BTCD
For Altcoins
With the increasing number of altcoins on the market, it can be seen that the market share of Bitcoin is showing signs of decline.
In recent years, some altcoins have become more popular, such as Ethereum and Ripple, causing the total market capitalization of altcoins to quickly surpass Bitcoin. In fact, there are times when altcoins start to attract more capital than Bitcoin. This is called the “altcoin season”.
Here are some milestones related to altcoins and BTC.D:
- 1.Bitcoin was launched in 2009 and was the only coin in the cryptocurrency market.
- In 2013, the first altcoins appeared, led by Litecoin (LTC) and Ripple (XRP). This appearance reduced BTC.D to 95%.
- In 2015, Vitalik Buterin successfully developed Ethereum (ETH) and DeFi products, bringing ETH’s total capitalization to second place in the market. However, Bitcoin’s market share has not changed much, hovering at around 90%-95%.
- In 2017, the ICO craze emerged, as a number of projects and companies joined crypto through the ICO fundraising method. The number of projects once reached 2,000 and raised up to 10 billion USD. Therefore, BTC.D fell to its lowest historical level when it was only 35%.
- In 2018, ICOs left many investors disappointed when they were constantly scammed, leading to the end of this narrative. Therefore, BTC.D has returned to the 50% mark. However, at this stage, most altcoins have not grown but Bitcoin has increased from 3,000 USD to nearly 9,000 USD.
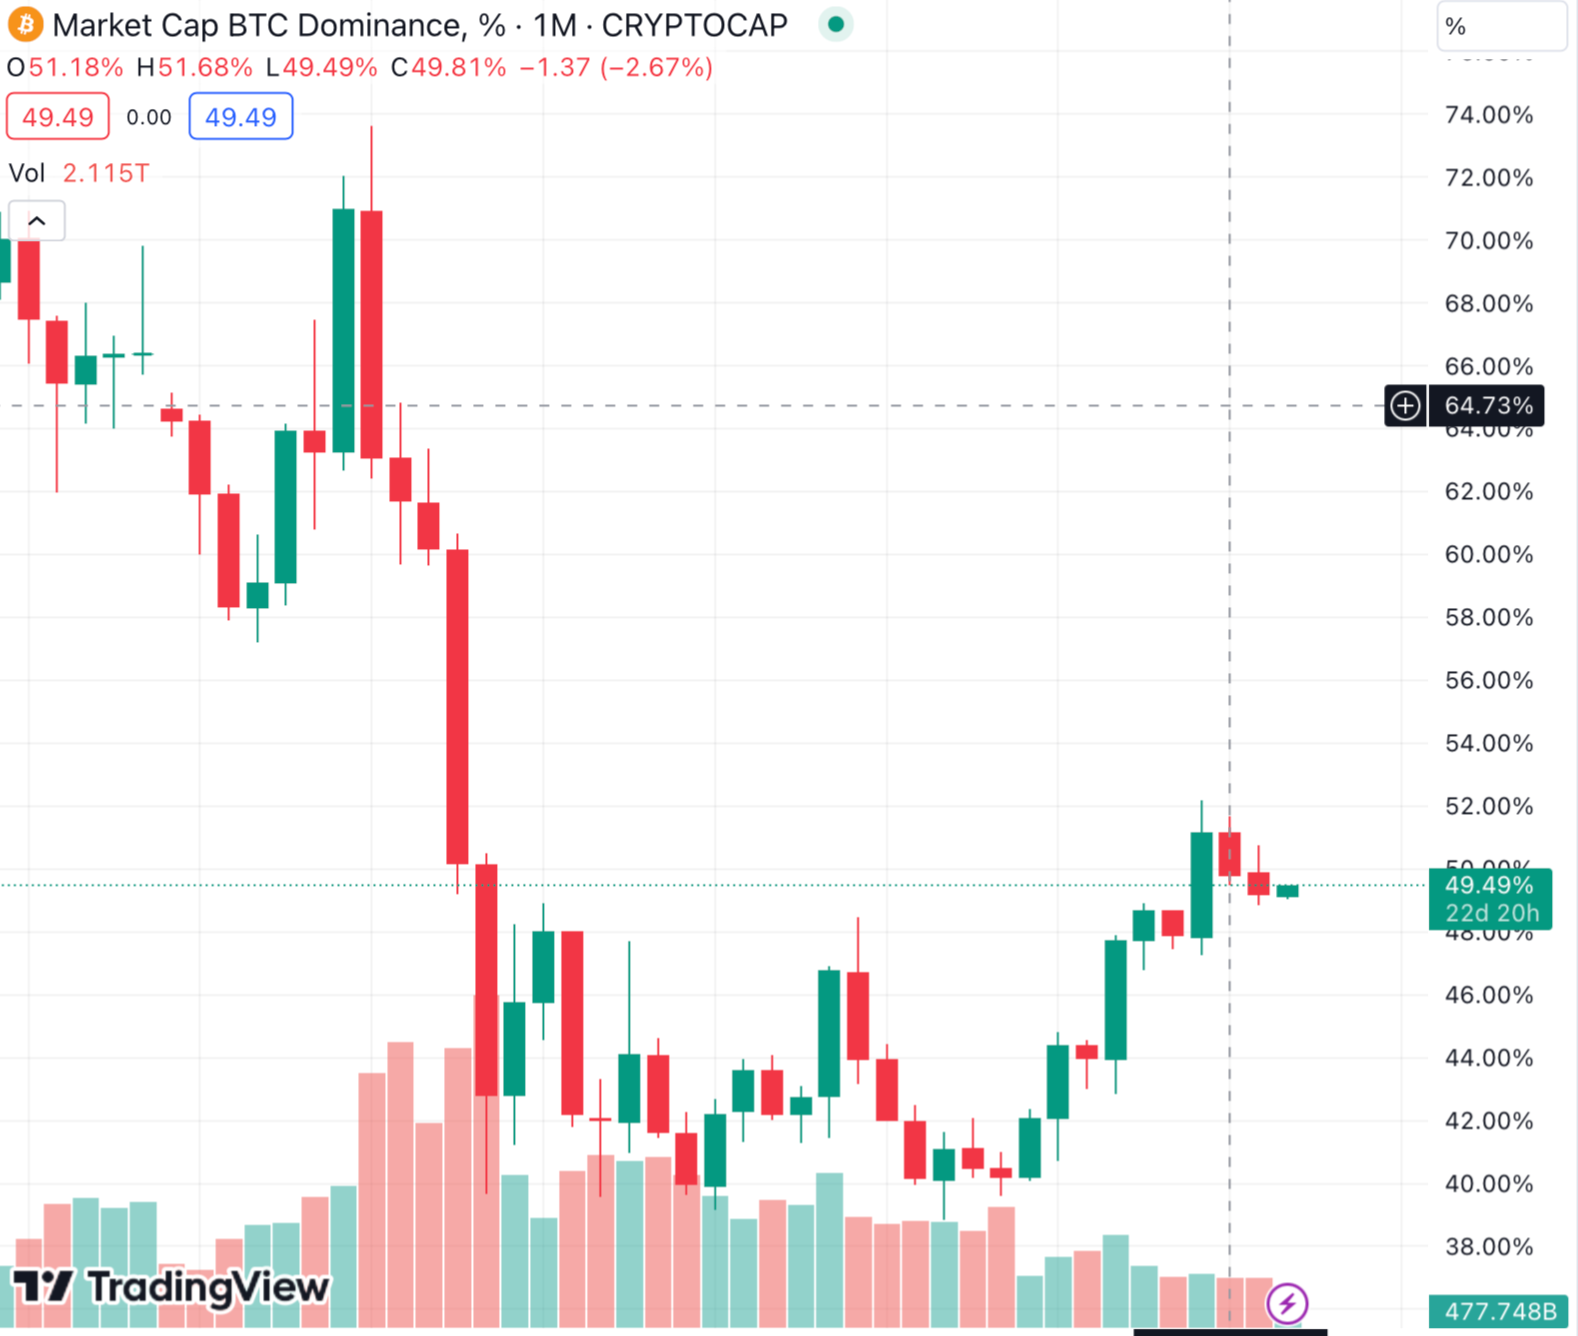
In 2020, the COVID-19 pandemic occurred, BTC.D increased sharply, reaching 70%, but altcoins did not have many outstanding changes. By the end of 2021, BTC.D fell to 39%, in return, altcoins had a significant growth. For example, Shiba (SHIB) increased by 40%, Solana (SOL) increased from 1.5 USD to 250 USD.
In general, every time the altcoin season comes, Bitcoin Dominance always shows signs of a sharp decline. Therefore, investors always monitor Bitcoin Dominance to find the right entry and exit points for altcoins.
For BTC
Currently, many investors combine the price of Bitcoin and the BTC.D index to make trading decisions. Specifically, here are the results of combining the two Bitcoin and BTC.D indices:
BTC.D increased
- BTC price rise: Money is flowing from altcoins to BTC.
- BTC price drop: The entire cryptocurrency market generally falls.
- BTC price sideways: Investors are taking profits from altcoins to Fiat (fiat)/BTC.
BTC.D decreased
- BTC price rise: Money is flowing into BTC, which can pull altcoins and the entire market along.
- BTC price drop: The entire cryptocurrency market generally falls.
- BTC price sideways: Money is flowing from BTC to altcoins. BTC going sideways means there will be less impact on the prices of altcoins, allowing them to freely develop. Good altcoins will grow strongly during this period.
BTC.D sideways
- BTC price rise: Money is flowing from outside of the cryptocurrency market to BTC.
- BTC price drop: The entire cryptocurrency market generally falls.
- BTC price sideways: BTC stands still, allowing altcoins to grow unaffected.
In addition, the strategy in the first line can be interpreted as when BTC.D increases, the price of BTC will increase accordingly, leading to investors buying BTC to earn profits, or those who are holding BTC may consider taking profits in the near future.
These strategies can be combined flexibly with the trading strategies of Holders or Traders.
How to determine the trend of BTC.D
BTC Dominance can also be considered like a token or coin price chart with technical analysis indicators such as: MA, EMA, Ichimoku, support zones, resistance zones, patterns, RSI, etc. Investors can consider BTC.D like a coin and analyze the ups and downs based on the above indicators.
Here is an example of how to determine the trend of BTC.D using Ichimoku Cloud:
Step 1: Go to tradingview.com, then open the BTC.D chart and add “Ichimoku”.
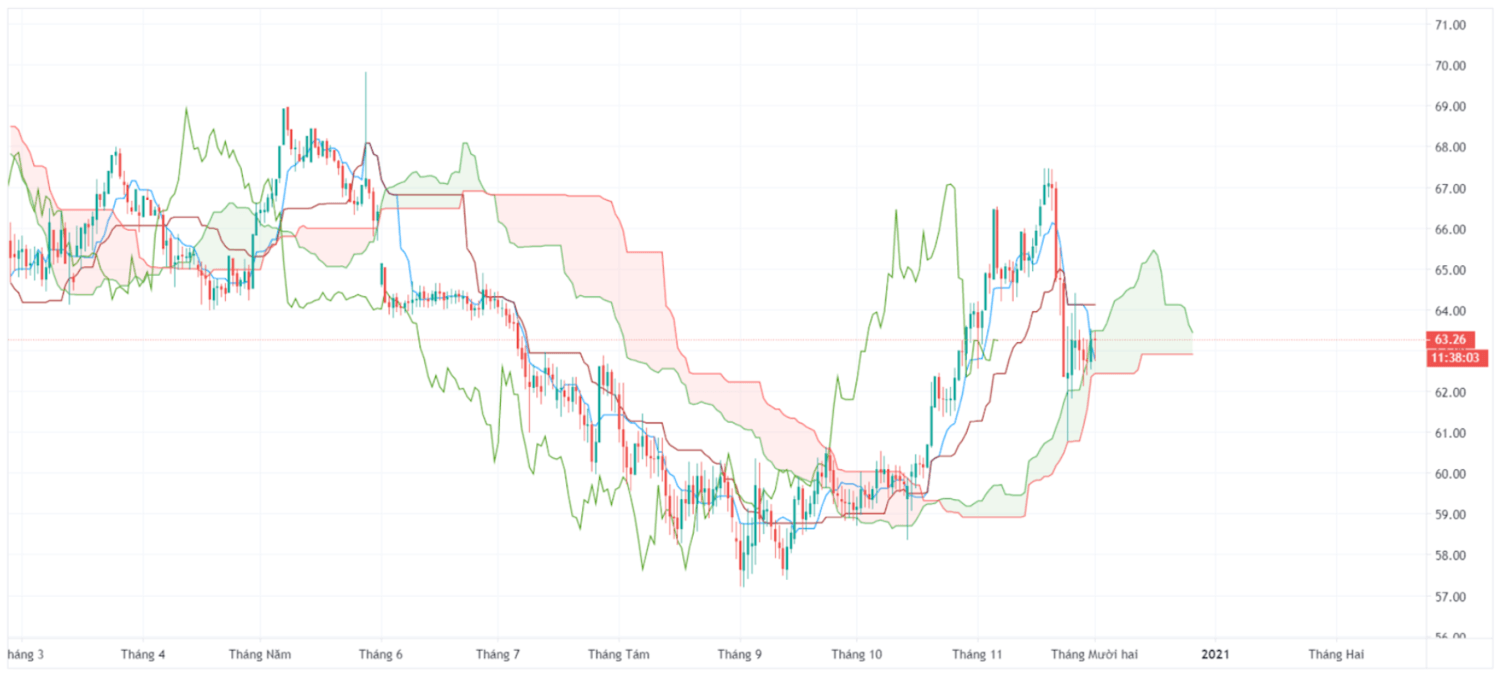
Step 2: Determine the trend with Ichimoku Cloud. Typically, a bullish trend occurs when the price is above the Ichimoku Cloud, a bearish trend occurs when the price is below the Ichimoku Cloud, or the trend is not determined if the price is within the Ichimoku Cloud.
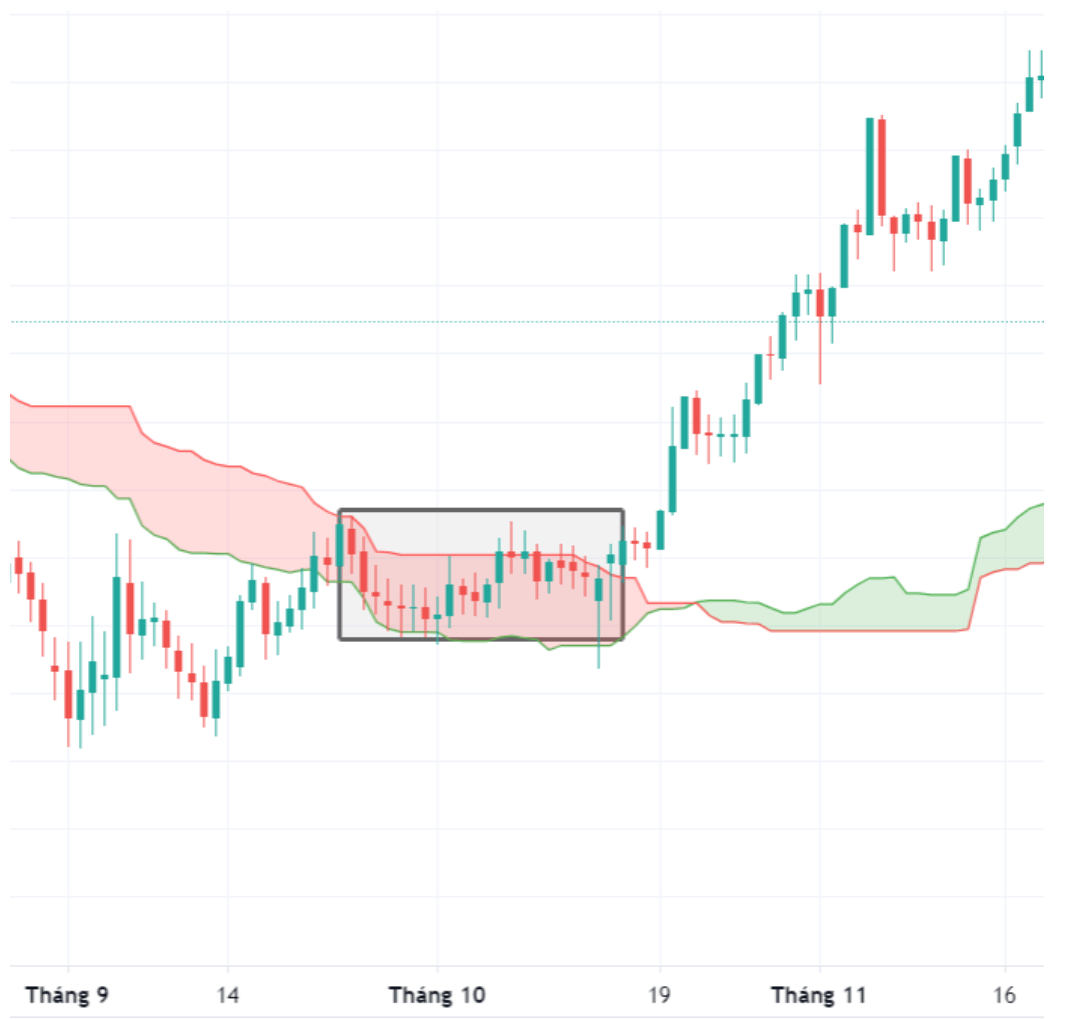
However, in practice, users can combine other indicators such as support and resistance, trendlines, Fibonacci, MA, etc. to improve results. In addition, you can combine multiple frames to see the market from multiple perspectives.
H4 – Daily: Daily.
Daily – Weekly: Weekly.
H4 – Daily – Weekly: Combines daily and weekly.
READ MORE NEWS ON
Bitcoin | Inflation Deflation Deflation Inflation Cryptocurrencies
* We hope this information will help you in your investment process, but this is not investment advice. Every investment carries risk, especially in this industry, so DYOR before making a decision.
Recommended


Be the first to know about crypto news every day
Get crypto analysis, news and updates right to your inbox! Sign up here so you don't miss a single newsletter.