
Introduce
Technical analysis stands as a leading method to spot trading chances, employing indicators and traders’ analytical prowess.
Why is Technical Analysis so prevalent? How can you master it?
Discover more in the upcoming article.
Concept
Technical analysis involves forecasting future prices by analyzing past data, acknowledging the inherent limitations of all analyses.
Within technical analysis, there are primary components:
- The information within the time frame of consideration.
- The technical indicators that the investor chooses to use.
- The investor’s ability to analyze and make decisions.
What Makes Learning Technical Analysis Essential?
The foundation of technical analysis is the “Dow Theory”, as soon as it was introduced by Charles Dow through articles. The Dow Theory has put forward prominent and market-dominant theories and is the foundation of modern technical analysis through charts.
And learning technical analysis is truly essential because:
- Prices reflect the information of the entire market. The clearest manifestation of the law of supply and demand is through prices, which reflect the market sentiment. You can screen the information that changes through prices, form the basis of analysis and make judgments for the future.
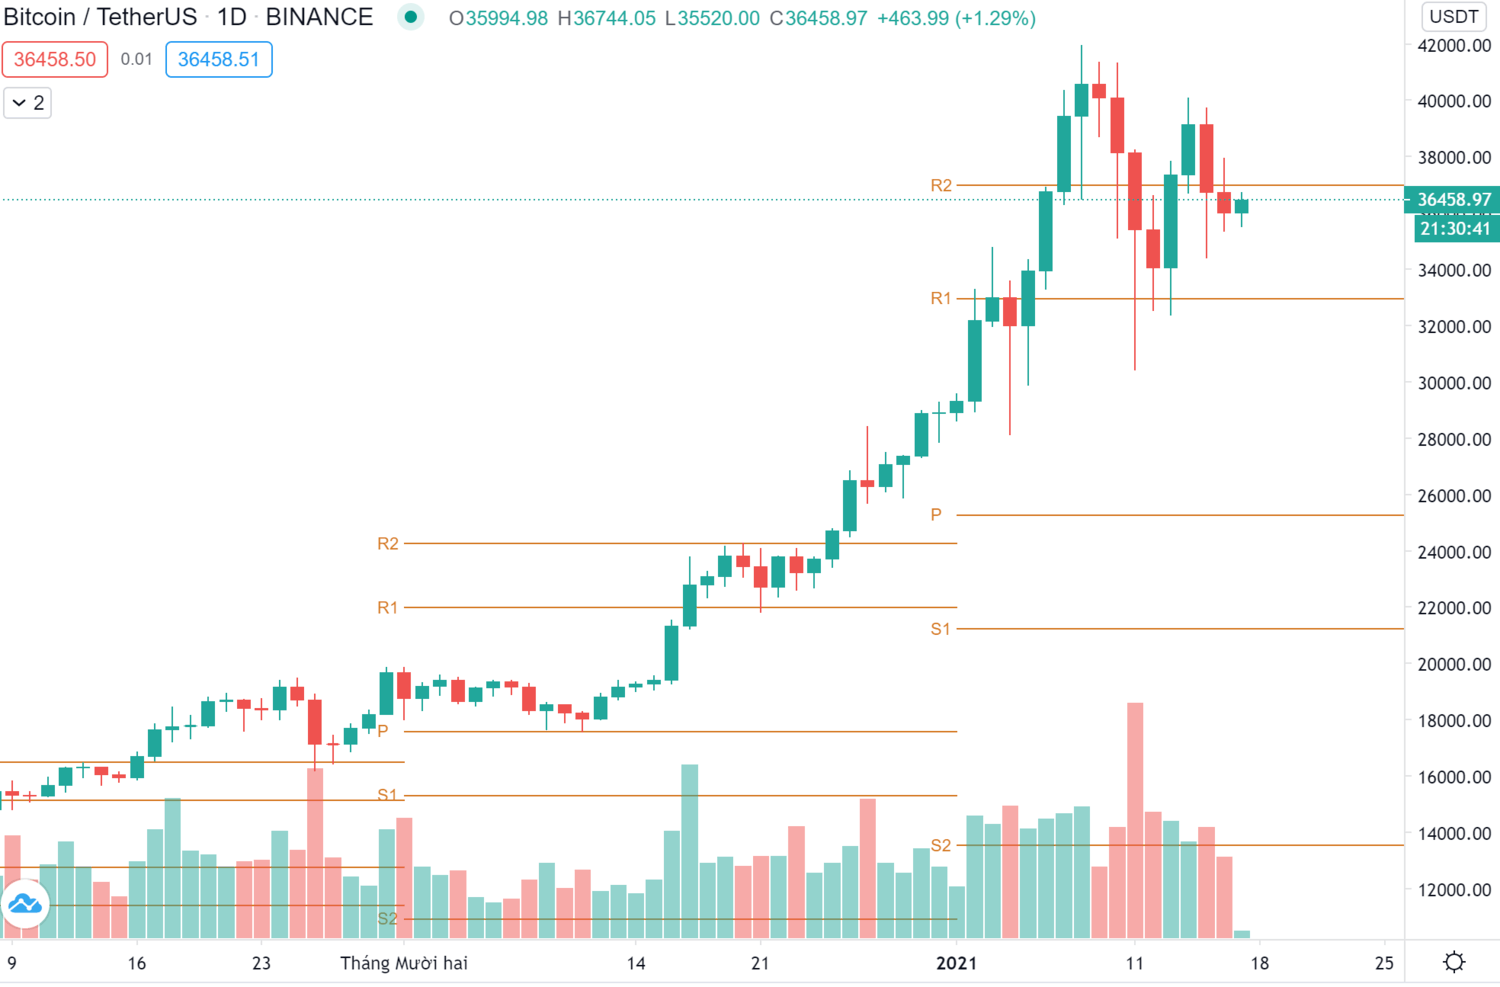
For example, the price of BTC fell by nearly $10,000 from nearly $42,000 to $30,500, but in the range of $30,000 to $35,000, there was a large volume of buying pressure that prevented the price from falling further. This formed a bullish pattern and pushed the price up to $38,000 the next day.
- Prices consistently adhere to specific trends and are not entirely random. Whether analyzing short-term or long-term time frames, one can anticipate price patterns to replicate past trends.
Current price action is a reliable basis for you to analyze future trends. Other forms of analysis can help you make a buy/sell decision, but most people use technical analysis to determine the entry/exit point.
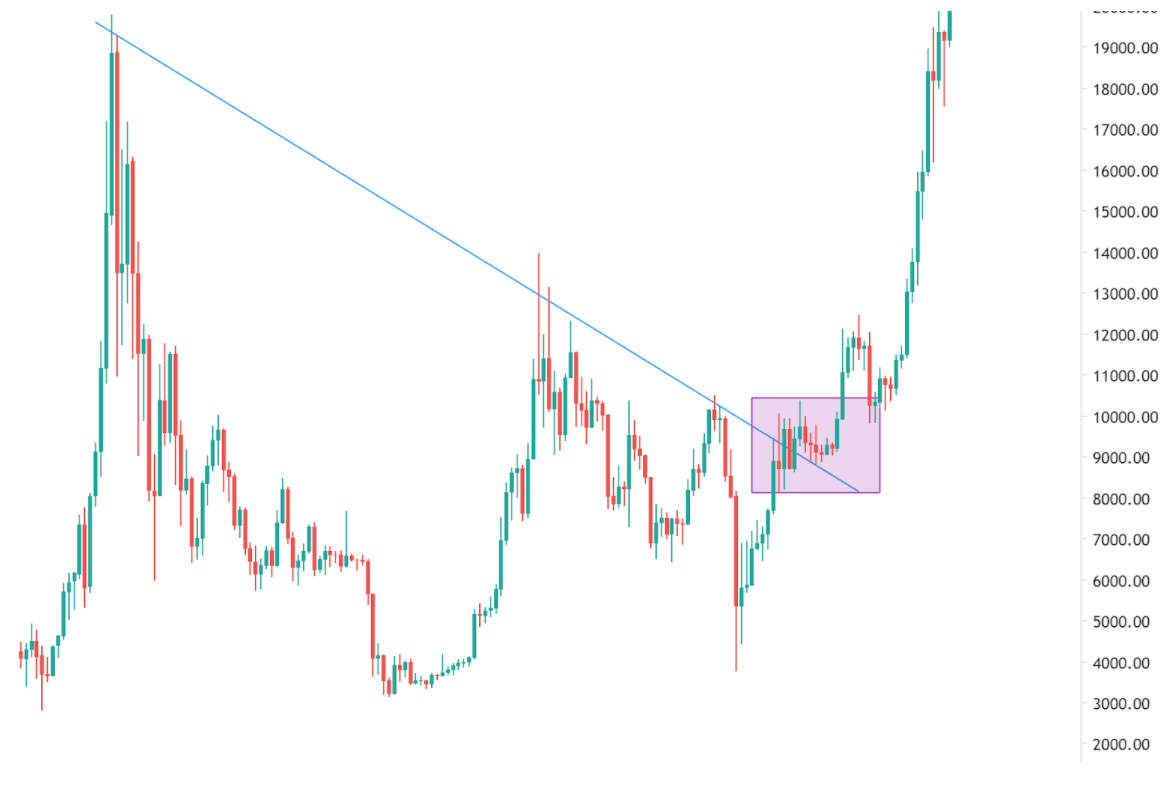
For example, when the BTC broke the $10,000 mark, it officially shifted the trend from downtrend to uptrend. Many investors rushed to buy BTC. But to choose a good entry point, technical analysis is definitely needed. If you always buy at $10,000/BTC, you have missed the trendline backtest at $8,900/BTC.
- Technical analysis can be completely learned and trained through the process: If you are new to the market and macro knowledge is still too difficult for you to access, technical analysis will be your starting point. Gradually through the training process, your judgment skills through historical price data will be further enhanced.
- Numbers don’t lie: Using technical analysis helps you avoid emotional decisions, which will increase your chances of winning and ensure profits, especially when you play margin or CFD contracts.
Technical analysis has existed for over a century. Why has it endured until now? The main answer lies in its consistent profitability over the past century for those employing technical analysis. It offers a more straightforward approach compared to comprehending macroeconomic aspects of the economy.
What Are The Benefits Of Technical Analysis?
Advantage
Focusing on price
The main goal of technical analysis is to predict future prices, focusing on the trend of the market. Prices often precede fundamental analysis, and technical analysis can analyze and predict future prices. Although price movements often occur in a short and sudden period of time, there are signs that have been foreshadowed for a long time according to the economic cycle.
Supply, demand, and price movements
The supply and demand of price movements are the foundation of all analysis because when demand increases/decreases, it is all reflected in the price on the graph. When the price rises and there is a huge volume of buying, it means that demand is very high and in the future, combined with the FOMO of the market, prices may continue to rise.
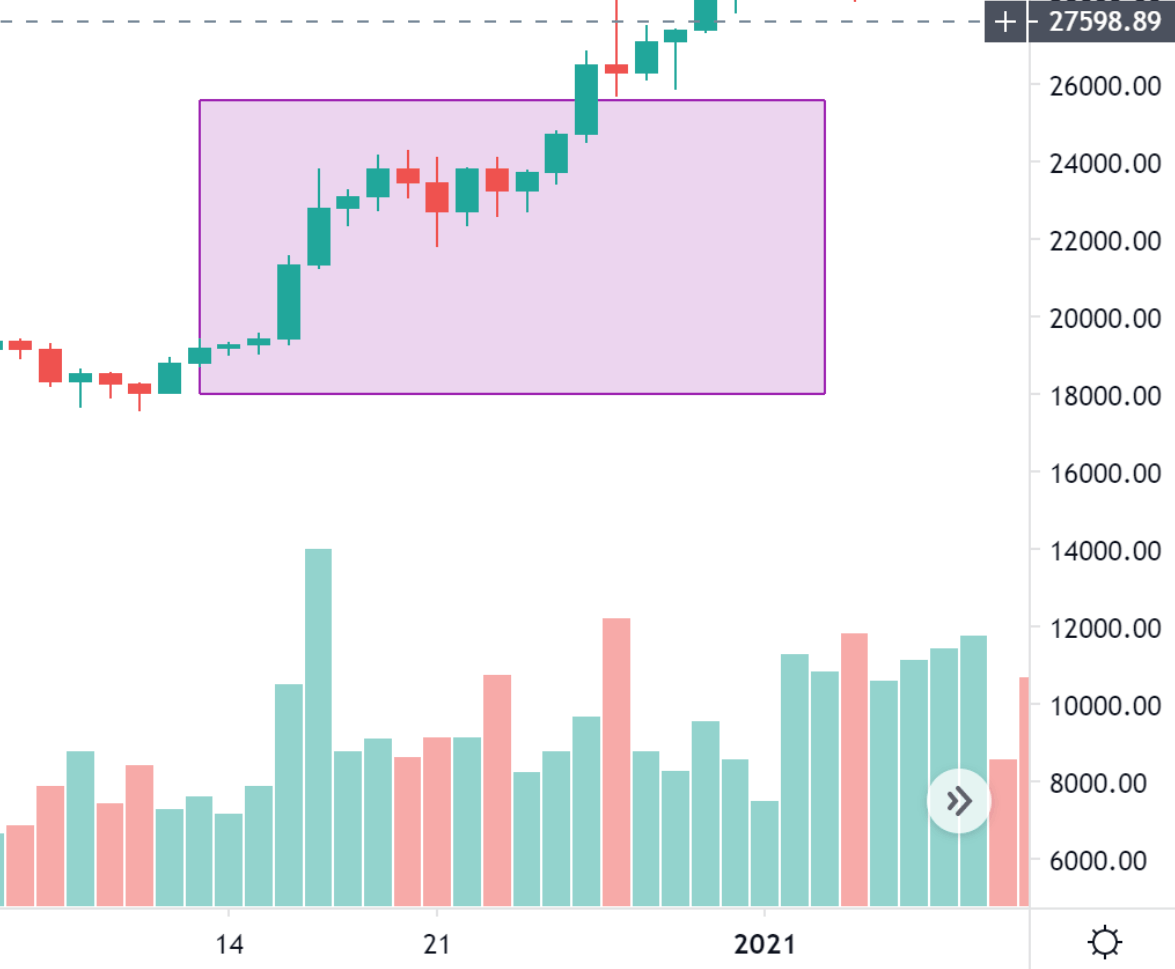
For instance, when the BTC price hits $20,000, if the selling pressure/profit-taking is low and the price doesn’t drop significantly, it suggests ongoing market expectations for price increase. As a result, the price continues to break the $20,000 mark and ascends.
Support and resistance
Basic chart analysis aids in recognizing support and resistance levels. When the price hovers within a range, it signifies a struggle between buyers and sellers. A breakout from this range indicates the emergence of dominant supply or demand.
Surpassing the upper resistance boundary indicates buyer dominance. However, touching the lower boundary suggests seller dominance, potentially leading the price back to the previous support region.
Historical price
Even if you are a fundamental analyst, charts can provide you with a lot of useful information. Charts are a representation of the historical price picture in the past when facing similar, repeated, or market developments before.
You can identify the following information:
- Price reaction at the time of important events.
- Price volatility of the past compared to the present.
- Trading volume in the past.
- The influence at the present to the entire market.
Support finding entry points
Technical analysis can help you identify the right entry point through patterns, indicators. Finding the right entry/exit point is as important as each of your buy/sell decisions because if you have a good entry point, your investment risk has been significantly reduced.
Technical analysis can help you more accurately identify demand (support) and supply (resistance) zones, rather than vaguely in a non-specific price range.
Disadvantage
Analysis can be erroneous
No matter what form of analysis, technical analysis also has errors. This is a form of analysis based on personal judgment, so errors are inevitable, especially if your judgment is too emotional.
It is important to be aware of these opinions when analyzing charts. If you are too conservative with your judgment, you are likely to make a wrong judgment.
Relativity
At the same time, with the same chart, and the same indicators, two analysts can make two opposite conclusions. However, this does not mean that one person is always right and the other is always wrong. Each analysis is relative and depends on the analyst’s perspective.
There are always opposing opinions
Even when a trend has been identified, there will always be dissenting opinions. This is more beneficial than harmful because in a volatile financial market, if everyone is cautious, fearful, or too optimistic about the market, the risk ratio will certainly be higher.
For example, when the Covid-19 pandemic spread in early 2020, the entire market fell into a state of anxiety that the pandemic would spread widely and affect the entire global economy. In March, the entire financial market turned red. The Crypto market was also not immune and the crash from $10,000 to $3,800 was completely predictable.
Interference
Not all signals or patterns always follow the rules, and there are many different types of indicators that you cannot use all of them for trading.
For example, not all cases of price breakout from a trendline breakout will follow the breakout trend. It is very likely that they are having a false breakout and the price will not follow the forecast of the model or trendline.
Commonly Used Indicators In Technical Analysis
Essentially, technical indicators are broadly categorized into two main groups: leading indicators and lagging indicators.
These are indicator groups, but in trading, it’s not necessary to be overly familiar with a multitude of indicators. I’ll introduce a few commonly used indicator groups.
Trend Indicator
This group of indicators will swiftly help traders identify market trends or potential shifts, mostly comprising lagging indicators (MA, MACD).
Moving Average (MA).
MACD – Moving Average Convergence Divergence.
Parabolic SAR (Stop and Reverse) follows a parabolic curve.
Momentum Indicator
Helps determine the speed of price changes over time by comparing the current closing price to a previous closing price, usually depicted as a line below the price chart. When divergence occurs, it can forecast future trend changes and falls under the category of leading indicators.
- Relative Strength Index (RSI).
- Stochastic Oscillator indicator.
Volatility Indicator
This indicator displays the rate of change irrespective of price direction. Typically based on past highest and lowest prices, it can identify reasonable buying zones through reversal price areas. These indicators all fall under the category of lagging indicators.
- Bollinger Bands (BB).
- Average True Range (ATR).
- Standard Deviation Indicator.
Volume Indicator
This indicator shows the strength of a trend or confirms a trend through trading volume. Trends are formed and confirmed through increasing trading volume and they often bring about significant price volatility and belong to the early indicators group.
- Trading volume.
- Chaikin Oscillator indicator.
- On-Balance Volume indicator.
- Volume Rate of Change.
Tips For Using Indicators In Technical Analysis
- Don’t use too many indicators: Using 4-5 indicators at the same time is too much for you. In general, you should only use 2-3 indicators effectively to avoid information overload.
- How to choose indicators: You should choose indicators that complement each other, and limit the use of indicators that contradict each other at the same time.
Combine other indicators to confirm the trend of the indicator being used. After the indicator you are using suggests a new trend, you should combine additional tools to be able to confirm them again.
- Understanding the indicators being used: You should understand what the indicators you are using are, how they work, and how to use them to make investment decisions in order to make accurate judgments during the analysis process.
Steps To Learn Technical Analysis
Step 1: Take A General Look At The Candlestick Chart
The goal of technical analysis is to make investment decisions for the future based on past data. Therefore, you need to consider whether the chart you want to apply technical analysis to is applicable or not through trading volume.
An indicator can only be analyzed correctly through technical analysis only when it is actually traded on the market through specific buying and selling volume. The more it is traded, the higher the possibility of applying technical analysis.
Step 2: Determine The Trend, Support – Resistance
At this point, we need to consider the main trend, support-resistance levels on each time frame from large to smaller frames, long-term and short-term to help us have a general overview of the important milestones of the main trend.
Note that support-resistance levels and trends in smaller time frames might contradict the main trend. They are merely adjustments within the overarching trend.
Step 3: Identify Patterns Indicating Support/Resistance For The Current Trend
Most trends follow a pattern of some kind. If you can identify what pattern a trend is following, and wait for it to confirm, your chances of trading with a high success rate will increase.
Step 4: Await Signals From Indicators, Conditions Met To Enter A Trade
When the indicators meet the conditions for a potential trade, verify them once more before proceeding to step 5.
Step 5: Plan The Trade Entry: Choose Entry/Exit Points, Stop-loss/Profit-taking Levels, Risk Ratio
Not every signal from an indicator can lead to a trade for you. After receiving a trading signal, you need to carefully plan your trade. You should consider the risk factors, the R:R ratio, and your capital management principles before making a decision whether to proceed with the trade or not.
Step 6: Execute & Adhere To The Plan
Once you have a specific trading plan, implement it, and it’s best to adhere to it. Each analysis carries different win probability ratios, and deviating from your plan could be a significant factor leading to heavier losses.
Conclude
Technical analysis is almost the first lesson when entering the financial market because it has specific principles, you can practice to gradually improve over time.
Although the market is always affected by sharks, fundamentally the skills of technical analysis still ensure a high winning rate for you and earn profits.
The analysis methods and how to use indicators are all detailedly guided in the technical analysis series of MarginATM. Please find and read it, and if you have any questions or discussions, don’t hesitate to exchange with us at MarginATM.
READ MORE NEWS ON
Bitcoin | Inflation Deflation Deflation Inflation Cryptocurrencies
* We hope this information will help you in your investment process, but this is not investment advice. Every investment carries risk, especially in this industry, so DYOR before making a decision.

Recommended


Be the first to know about crypto news every day
Get crypto analysis, news and updates right to your inbox! Sign up here so you don't miss a single newsletter.